
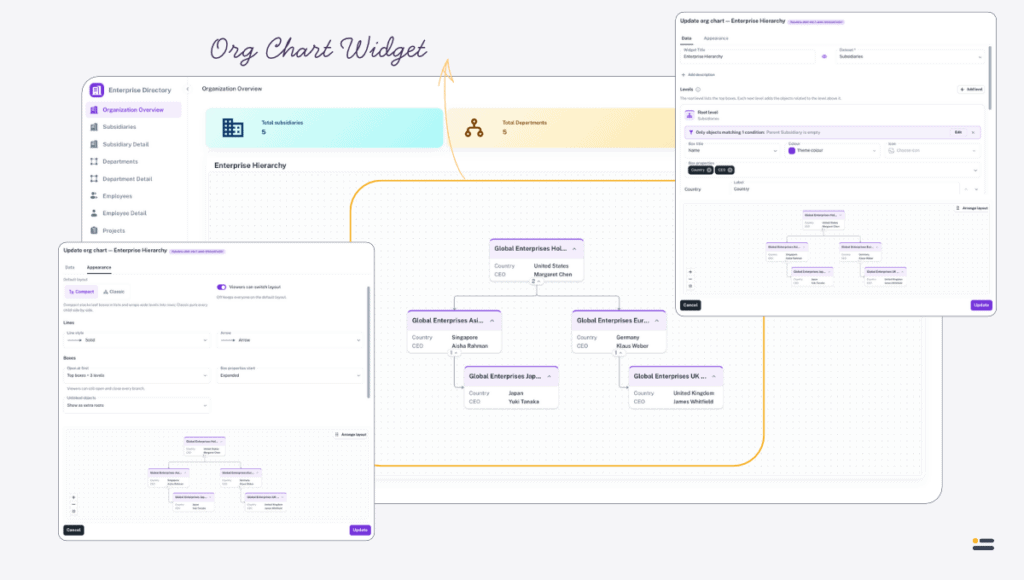
Use the Org chart widget to draw objects as boxes in a hierarchy — employees under their managers, departments with their members, projects with the people on them.
When to use it #
An Org chart widget shows how objects relate to one another, rather than listing them or totalling them. Use it for:
- an organisation chart, drawn from an Employees dataset whose Manager property points at another employee;
- departments, each with the people who belong to it;
- any structure the data already holds through Dropdown properties, such as sites, buildings, and rooms.
The chart is built entirely from Dropdown properties that relate one object to another. It adds no relationships of its own, so the structure has to exist in the datasets first. See Connect related datasets for detailed instructions on relating datasets.
Where users need to work through the objects themselves, use a Table widget. Where they need totals, use a Chart widget. The Org chart widget is a separate widget type, not a type of chart, and shares none of the Chart widget’s settings.
Add an Org chart widget #
To add an Org chart widget:
- Open the page and enable Layout edit mode.
- Select Add a widget.
- Select the Org chart tile, or drag it onto the page.
- Enter a Widget Title and choose a Dataset.
- Configure the Root level, and add a level for each step down the hierarchy.
- Select Create.
- Save the page layout.
An org chart needs a title, a dataset, and a relationship for every level below the root before it will save. Everything else has a working default.
Configuration #
The dialog is arranged in two tabs, Data and Appearance. A live preview at the bottom of the dialog redraws the chart as you change either.
Basic Information #
Widget Title is required, and is shown by default; the eye icon beside it hides it. Description is optional and hidden by default, with its own visibility control.
Dataset is required. It is the dataset of the top boxes, and the root level always uses it. Changing it starts the levels again from a single root level on the new dataset, and clears any arrangement you have saved.
Levels #
The Levels section builds the hierarchy one level at a time. The information icon beside the heading, How levels work, summarises the model.
- The Root level holds the top boxes: objects of the widget’s dataset.
- Each level below adds the objects related to the boxes of the level above it, through a Dropdown property. Select Add level to add one, and the bin icon to remove it.
An org chart can have at most ten levels.
Relationship chooses how a level hangs under the level above. It lists every Dropdown property that relates the two, in both directions, grouped as:
- The parent points to its children — a Dropdown property on the box above lists its children, as a Department’s Members property lists its people;
- The children point to their parent — each child names its parent, as an Employee’s Manager property names another employee.
Where no Dropdown property relates any dataset to the level above, the field says No dropdown relates another dataset to the level above.
Repeat for every level below follows the same relationship again and again on its own results — managers, then their reports, then their reports’ reports — so one level draws a hierarchy of any depth. It is available only when a relationship relates a dataset to itself, such as Employee to Employee through Manager. A repeated relationship stops after 25 steps, which protects the chart from data that loops back on itself.
To build a classic organisation chart from one Employees dataset with a Manager property:
- Choose the Employees dataset as the Dataset.
- On the Root level, add a filter of Manager is empty, so only the people at the top become top boxes.
- Select Add level.
- Under Relationship, choose the Manager relationship listed under The children point to their parent.
- Switch on Repeat for every level below.
Level filters #
Each level has a filter bar that reads All objects of this level are shown until you add a filter. Select Add filter to open Level filters, where conditions are built in groups exactly as for a computed value — see Computed values. Once a level has filters, the bar summarises them, Edit reopens them, and Remove filters clears them.
On the root level, filters decide which objects are the top boxes. On a level below, an object the filters hide hides its whole branch with it.
A filter can compare against one of the page’s parameters, so a chart on a department’s details page can start from that department. The preview cannot resolve page parameters, so it leaves those conditions out and says Parameter filters apply on the page.
Boxes #
Each level also sets how its boxes look:
- Box title — the property shown as the box’s heading. It defaults to Name, and offers the level’s String, Integer, Decimal, Date, and DateTime properties.
- Colour — the accent colour of the level’s boxes. Left empty, it follows the Theme colour.
- Icon — an optional icon shown in each box, chosen with Choose icon and cleared with Remove icon.
- Box properties — the values shown inside each box, in order. Each can be given its own Label, which otherwise defaults to the property’s name, and reordered with Move up and Move down.
Two or three values per box is usually enough. Every value makes every box taller, and a chart of tall boxes is harder to read at a glance.
Appearance #
The Appearance tab. Nothing in it is required.
Layout sets how the boxes are arranged:
- Default layout — Compact, the default, stacks boxes that have no children of their own in lists under their parent, and wraps wide levels into rows, so a large chart stays roughly the shape of the screen. Classic puts every child side by side under its parent.
- Viewers can switch layout — on by default. Switch it off to keep everyone on the default layout; the layout controls then disappear from the widget.
Lines sets the connectors between boxes: Line style is Solid, Dashed, or Dotted, and Arrow is None, Arrow, or Open arrow. Each option is drawn beside its name.
Boxes holds three settings:
- Open at first — how much of the hierarchy is open when the page loads: Everything, the default, Only the top boxes, or Top boxes + 1 level to + 3 levels. Viewers can still open and close every branch.
- Box properties start — Expanded, the default, or Collapsed, in which case each box shows its title until the viewer opens its properties.
- Unlinked objects — what to do with objects of a level whose relationship is empty or points to an object that is not shown. Show as extra roots, the default, draws them as additional top boxes with a dashed border; Hide leaves them out.
Click decides what Clicking a box does:
- Nothing — the default;
- Show object details — opens a read-only view of the object, which works for read-only users too;
- Open a page — opens the page you choose under Navigate to page on click, with Open in new tab available once a page is chosen. Each of the destination’s parameters can take the clicked box’s object or a value from one of this page’s parameters. The chart will not save until a page is chosen;
- Expand / collapse its branch — opens or closes the boxes under the one clicked.
Clicking does nothing in layout edit mode, so that boxes can be selected and moved without triggering the action.
Arrange the layout #
The automatic layout is usually enough, but you can place boxes yourself.
To arrange the boxes:
- In the widget’s dialog, select Arrange layout above the preview.
- Drag boxes to where you want them.
- Select Done.
- Select Create or Update to save the widget.
Undo and Redo step through your moves, also with Ctrl+Z and Ctrl+Y, or ⌘Z and ⇧⌘Z on a Mac. Reset layout clears every position you have set, and can itself be undone. While arranging, every branch is open, so that every box can be placed.
An arrangement only pins the boxes you moved. The automatic layout still places everything else around them, so a new object appears without overlapping a pinned box, and a collapsed branch leaves no gap.
The arrangement belongs to the default layout it was made in. Changing Default layout on a chart with an arrangement asks Change layout? first, because the arranged positions are cleared. A viewer who switches to the other layout sees it arranged automatically.
Preview #
The preview draws the chart from the dataset as it is now. Until every level below the root has a relationship it reads Pick a dataset and a relationship for every level to preview the org chart., and when nothing matches the configuration it reads No objects match this configuration.
Using the chart on the page #
A viewer can zoom with the mouse wheel or a pinch, drag to pan, and select Fit chart to bring the whole chart back into view. When the chart is zoomed far out, boxes show only their titles, so a large chart stays quick to move around.
Each box carries its own controls. Expand branch and Collapse branch open and close the boxes under it, and a badge shows how many children it has. Show properties and Hide properties open and close its values. These choices are the viewer’s own: they are not saved, and they do not change what anyone else sees.
These controls appear on the widget’s toolbar, for every user and not only in edit mode:
- Layout — switches between Compact and Classic for your own view, with the chart’s default marked (default), and Reset to default to return to it. It is hidden when Viewers can switch layout is off.
- Full screen — opens the chart in a full-screen window, with the layout switch in its header and Export in its footer. Collapsing branches in the full-screen window does not change the chart on the page.
- Download chart — exports the chart as a PNG image or a PDF document.
Export the chart #
An export contains every box that is currently open, not only the part on screen, in the layout you are looking at. Collapsed branches are left out, and a box’s values are included only where its properties are open.
The file is prepared in the background. Auclio says You can keep working. The download appears here when it is ready., and a Download button appears in the same message when it is. You can carry on working, or leave the page, in the meantime. Only one export of a chart runs at a time.
A very large chart is too big to export as an image. PNG image is then unavailable, with the explanation Too large for an image — use PDF.
What the chart shows #
Boxes respect permissions. A viewer sees only the objects they can read, so two people can see differently shaped charts on the same page.
The chart updates itself when the objects behind it change.
When nothing matches, the widget reads No objects match this org chart.
Sizing on the grid #
An Org chart is added at the same size as a Chart widget: twenty rows tall, spanning the full width on a phone or a small tablet and half the grid on a large screen. Give it room — a hierarchy needs width as well as height.
An Org chart can only go in a page’s main area. Like the Table, Text Grid, Form, and Chart widgets, it cannot be added to a header or a footer.
Limits worth knowing #
A chart draws at most 2,000 objects. Beyond that, it shows the first 2,000 and says Showing the first 2000 objects. Add filters to the levels to see the rest. Filter the levels, or start the chart lower down the hierarchy, to bring it under the limit.
A chart has at most ten levels, and a repeated level stops after 25 steps.
Recommendations #
When using Org chart widgets:
- filter the root level so that only the true top of the hierarchy becomes top boxes, and let the levels below find everyone else;
- use Repeat for every level below for a dataset related to itself, rather than adding the same level several times;
- give each level its own colour or icon when a chart mixes datasets, so viewers can tell a department from a person;
- keep box properties to two or three values;
- set Open at first to a few levels on a large chart, so it opens readable and viewers expand only the branches they need;
- arrange the layout only when the automatic one genuinely misleads, because a hand-placed chart does not reflow as the data changes.
